Cost of Goods Sold
- The Cost of Goods (COG) analytics page displays visualizations of the following data:
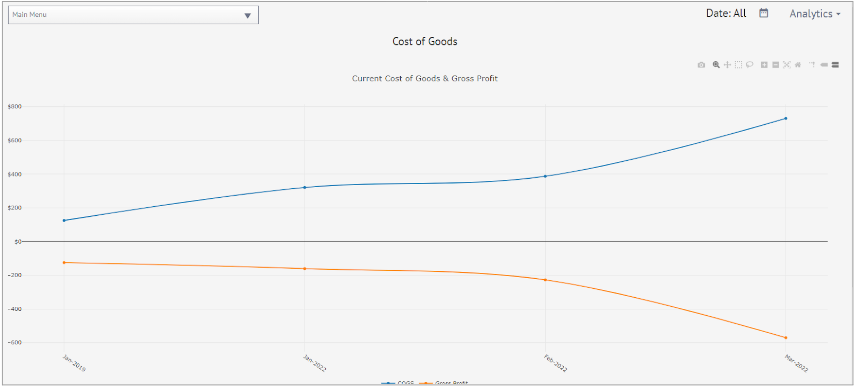
Current Cost of Goods & Gross Profit – a line graph displaying the fluctuations in current COG and gross profit over time
Average Cost of Goods & Gross Profit – a line graph displaying the average COG and gross profit over time (scroll down to see)

